Changelog
2025/06/08: Included a quick look; improved Docker networking in the compose file
Motivation
If you host applications and websites accessible to the public, it can be useful to monitor how these resources are used. Understanding what users access and from where can help you identify popular content and check if your server can handle requests efficiently.
User tracking is a critical (in many ways) aspect of the internet, and there are many tools available, ranging from privacy-friendly to highly invasive. In this guide, we will look at a few tools with different tracking methods and provide a tutorial on how to install and use GoAccess with Nginx Proxy Manager (NPM) to track all your proxy hosts in one place.
Traffic Monitoring Tools
When it comes to monitoring website traffic, there are several tools available that represent different approaches to user tracking, ranging from privacy-friendly methods that respect user anonymity to highly-invasive techniques that collect detailed user data across multiple sites. The primary approaches include:
- Server Logs Only: These tools analyze server logs and do not interact with the user’s browser, offering high privacy.
- Active User Tracking via Cookies: These tools use cookies and other browser-based technologies to track users across sessions, providing more granular data but raising privacy concerns.
- Severe Tracking Across Sites: These tools track user behavior across multiple websites and sessions, often leading to comprehensive user profiles but with significant privacy implications. Only used in business context and not relevant for smaller use cases.
Another factor is visibility to third parties. Some tools can be self-hosted, so data never leaves your server. Others rely on third-party integration.
Some notable tools for personal use cases inlcude:
GoAccess. Visualizes existing server logs. Basic information, open source, locally hosted, free, no changes to websites necessary. Best privacy level as no new data is collected, and data never leaves the originating server.
Matomo. Visualizes server logs and offers the option to collect further information via cookies. Open source, local or third party hosting, free or subscription based, may require the insertion of a code snippet into your websites. Varying levels of privacy (depending on settings), but overall privacy friendly.
Google Analytics. Uses cookies and site tracking. Has a free plan for smaller use cases. Not open source, cannot be hosted locally. Requires a Google account, and the insertion of a code snippet into your websites. The level of privacy depends on the settings, but is overall less privacy friendly.
Which tool to use depends on the use case. I recommend GoAccess for simple use cases. Check out which information is offered by GoAccess below. Matomo is especially useful if you need room to expand the user data collection (e.g. if you need detailed resource interaction metrics for improving educational resources).
Using GoAccess in Combination With Nginx Proxy Manager
In previous tutorials, I showed you how to set up NPM using Docker Compose to secure your hosted webpages. Since NPM acts as a gatekeeper, routing requests from users to your Docker containers and logging these requests, it’s an excellent place to gather insights into the usage of your server’s resources. Combining NPM with a server log visualization tool like GoAccess allows for efficient monitoring of all hosted resources.
Thankfully, we don’t need to figure out the integration from scratch. We can leverage Xavier Hernandez’s goaccess-for-nginxproxymanager Docker image to seamlessly integrate GoAccess with NPM.
For smaller projects, this setup has some distinct advantages: Easy setup, privacy-friendly, no customization of applications and webpages required, and nice visualizations of traffic.
📦 App Info
- Logo:

- Purpose: Real-time web log analyzer with visual reports for Nginx Proxy Manager logs
- Deployment: Docker compose
🔍 Tech & Usage
- Stack: GoAccess (C-based), HTML5 dashboard
- Memory: ~12 MB idle
- Disk: ~150 MB
- CPU: Minimal
📜 License & Community
- License: Open Source (MIT)
- Pricing: Free
- Type: Community-driven integration of GoAccess + NPM
- User Base: Niche but active within self-hosting and NPM users
Step 1: Setting Up GoAccess For Nginx Proxy Manager
First, create a directory for your GoAccess files and navigate to it:
mkdir goaccess-for-nginxproxymanager
cd goaccess-for-nginxproxymanager
Next, create a ‘docker-compose.yml’ file:
sudo nano docker-compose.ymlPaste the following content into the file. Refer to the annotations for necessary changes. For more options, consult the official setup guide.
services:
goaccess:
image: 'xavierh/goaccess-for-nginxproxymanager:latest'
container_name: goaccess
restart: unless-stopped
expose:
- '7880'
environment:
- TZ=America/New_York
- SKIP_ARCHIVED_LOGS=False
- DEBUG=False
- BASIC_AUTH=True
- BASIC_AUTH_USERNAME=user
- BASIC_AUTH_PASSWORD=password
- LOG_TYPE=NPM
- ENABLE_BROWSERS_LIST=True
- HTML_REFRESH=60
- KEEP_LAST=360
- INCLUDE_PROXY_HOSTS=4
volumes:
- /path/to/host/nginx/logs:/opt/log
networks:
- npmnet
networks:
npmnet:
- external: true- 1
- We expose only the internal port to the specified Docker network. Make sure it exists, and NPM is on it, too.
- 2
- Change the time zone to your region (e.g., ‘Europe/Berlin’). Refer to Wikipedia’s list of time zones if unsure.
- 3
- Setting to ‘True’ protects your GoAccess interface with authentication.
- 4
- Set the username for login.
- 5
- Set the password for login.
- 6
- Refresh the HTML report every specified number of seconds.
- 7
- Specify the number of days to keep in storage. I set this to one year. I assumed it would not take up much space. The dashboard shows the size of the log, so I will reduce this setting if necessary.
- 8
- Specify which domain logs to include in GoAccess reports by proxy host number. I was only interested in monitoring traffic to my website (this site), so I entered its proxy host number (4). To find out which domain has which number, go to your NPM proxy host interface and click on the three dots menu. The proxy host number will be listed there. Enter multiple proxy host numbers separated by commas (e.g. ‘2,4,7’). Delete this line if you want to track all domains.
- 9
- Specify the path to the NPM logs (explained below).
- 10
- Attach the service to an existing Docker network.
- 11
- Specify that the Docker network already exists.
One important thing to change is the path to the Nginx log in the volumes setting. To find your log path, follow these steps:
Move to your NPM directory. For example:
cd nproxyList the contents of the directory:
lsMove into the ‘data’ directory:
cd dataList its contents:
lsThe ‘logs’ directory stores information about resource requests managed by NPM. That’s the first part of the path you need to enter in your ‘docker-compose.yml’ file. Append an ‘/logs/:/opt/log’. The full path might look like this: ‘home/User/nproxy/data/logs/:/opt/log’.
When you’re finished with the compose file, launch the containers:
docker compose up -dStep 2: Accessing Traffic Reports
To access the GoAccess interface via a subdomain:
Register an A-record for this subdomain with your domain registrar.
In the NPM interface, add a new proxy host.
Enter a subdomain (e.g., ‘goaccess’), use the service name ‘goaccess’ we specified as the host, and set the port to 7880. Enable features, especially websocket support. Add an SSL certificate and security features.
Try to access the GoAccess interface at
http://goaccess.yourdomain.com.
Troubleshooting
Check your docker-compose.yml file carefully for spelling and indentation errors. Often errors are just minor configuration mistakes.
Refer to the official setup guide and watch for changes in the Docker Compose setup. There are also ‘Issues’ and ‘Discussions’ sections on GitHub worth checking out.
There are several other tutorials available, for example here. This tutorial is also useful if you have specified a custom Docker network in your NPM setup. You will need to specify this in the GoAccess compose file, otherwise NPM and GoAccess won’t be able to communicate properly.
Step 3: Reviewing Traffic Reports
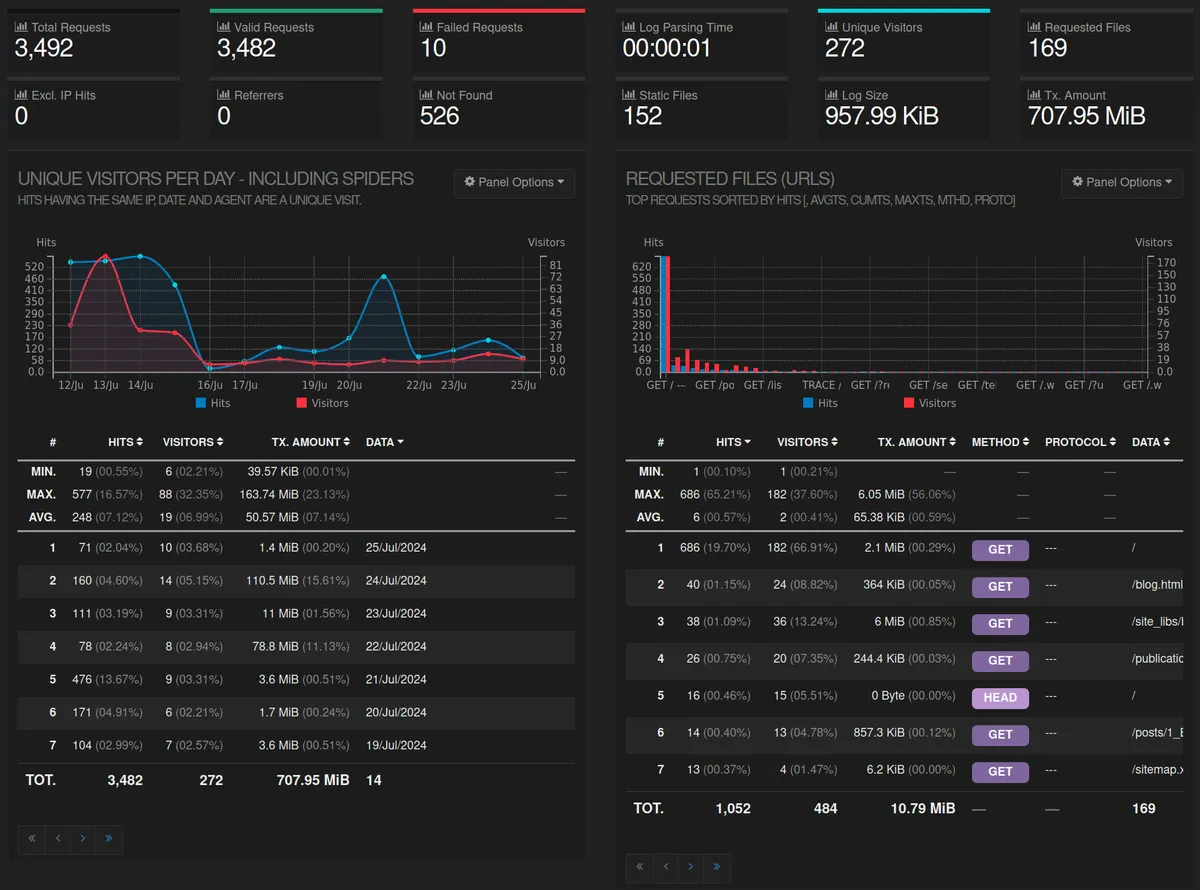
Let’s take a look at the traffic reports from my website and see what data we can inspect. The top section of the GoAccess interface displays general server metrics and usage data:
- Request Statistics: Total requests, valid requests, failed requests, and not found errors.
- Performance Metrics: Log parsing time and log size.
- Visitor Information: Unique visitors and referrers.
- Traffic Data: Amount of data transferred and static files served.
Charts provide a more detailed view of these aspects. Starting with unique visitors per day and most requested files.
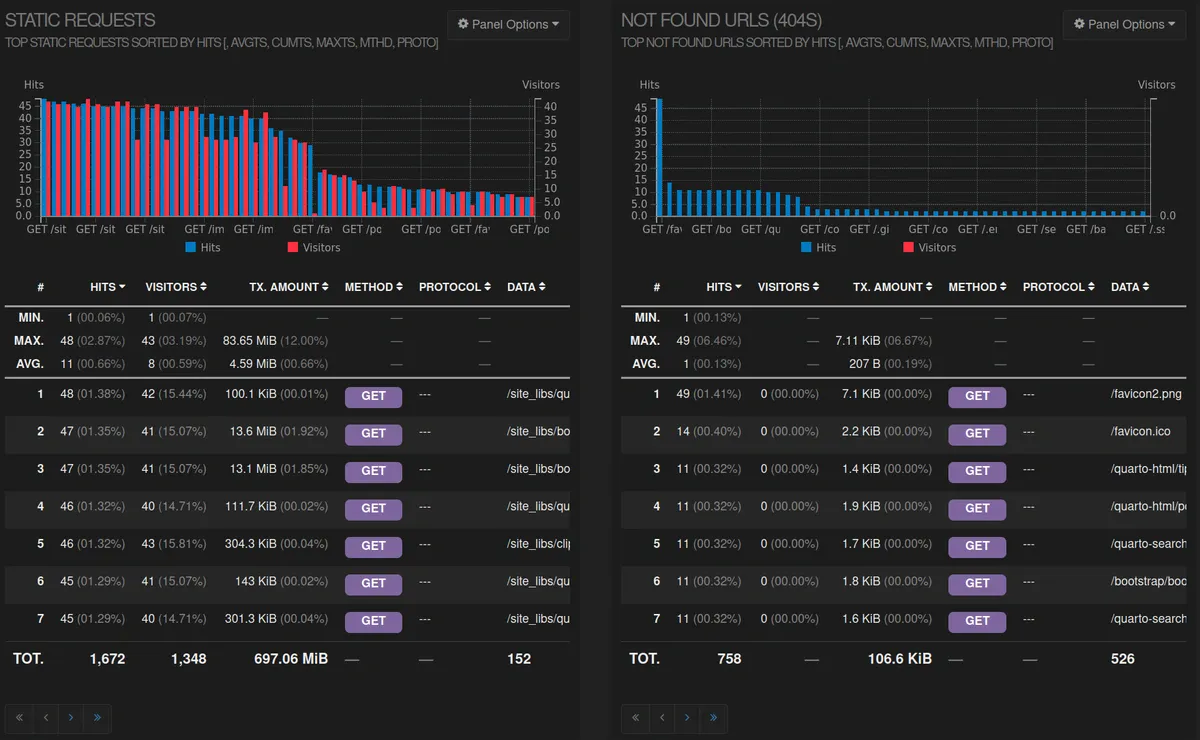
Next, static requests and not found URLs are shown:
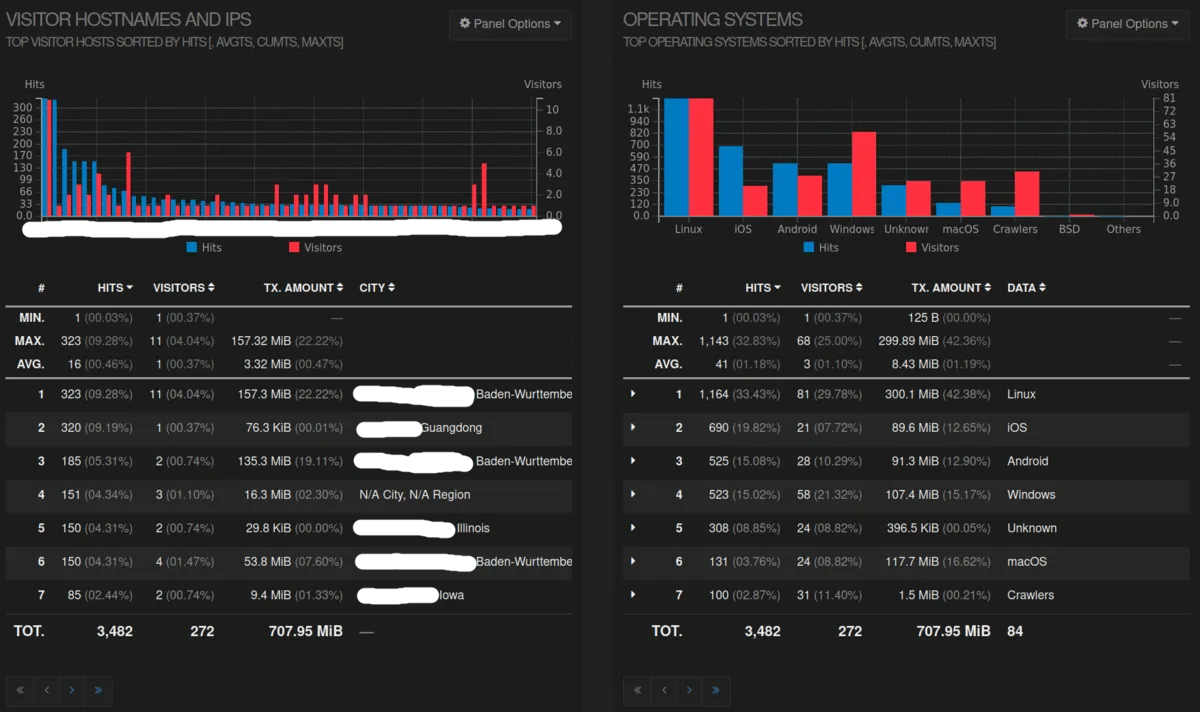
Next are visitors’ hostnames, IPs and operating systems. I have redacted IPs and city information. Hello Guangdong 🇨🇳, the birth place of Dim Sum delicacies , Illinois 🇺🇸, home of the Chicago-style pizza, and Iowa 🇺🇸, provider of Scotcheroos. What a menu!
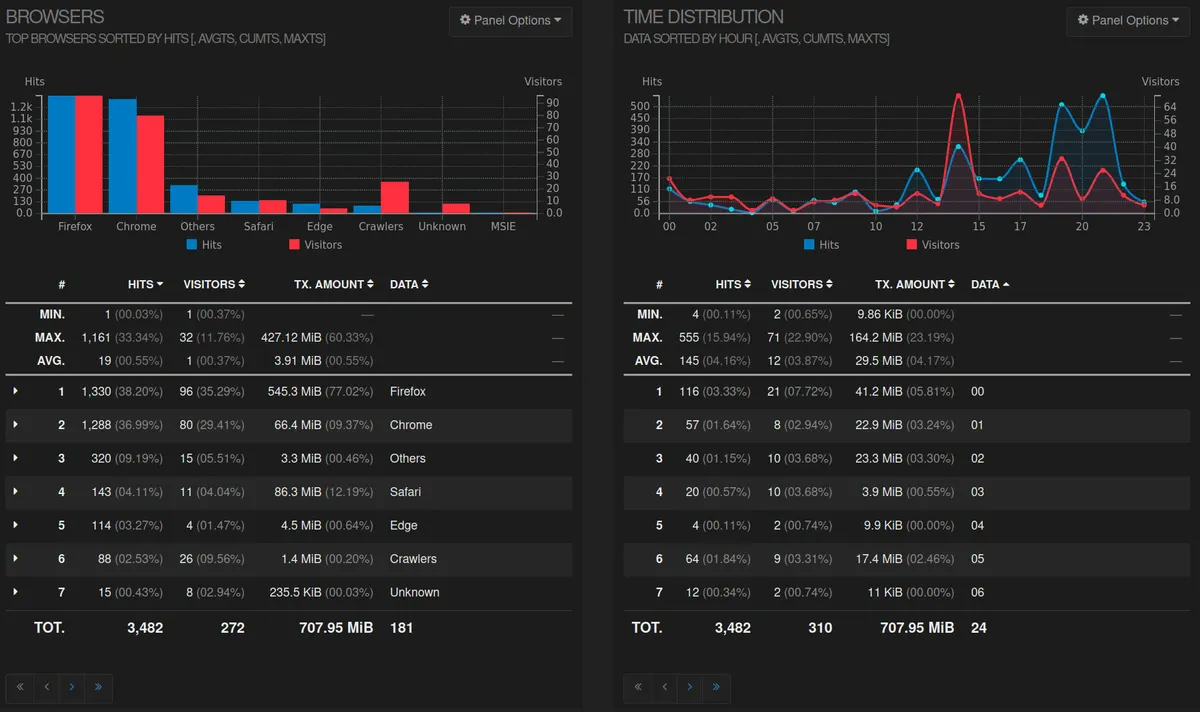
Browsers and time distribution of hits and visitors:
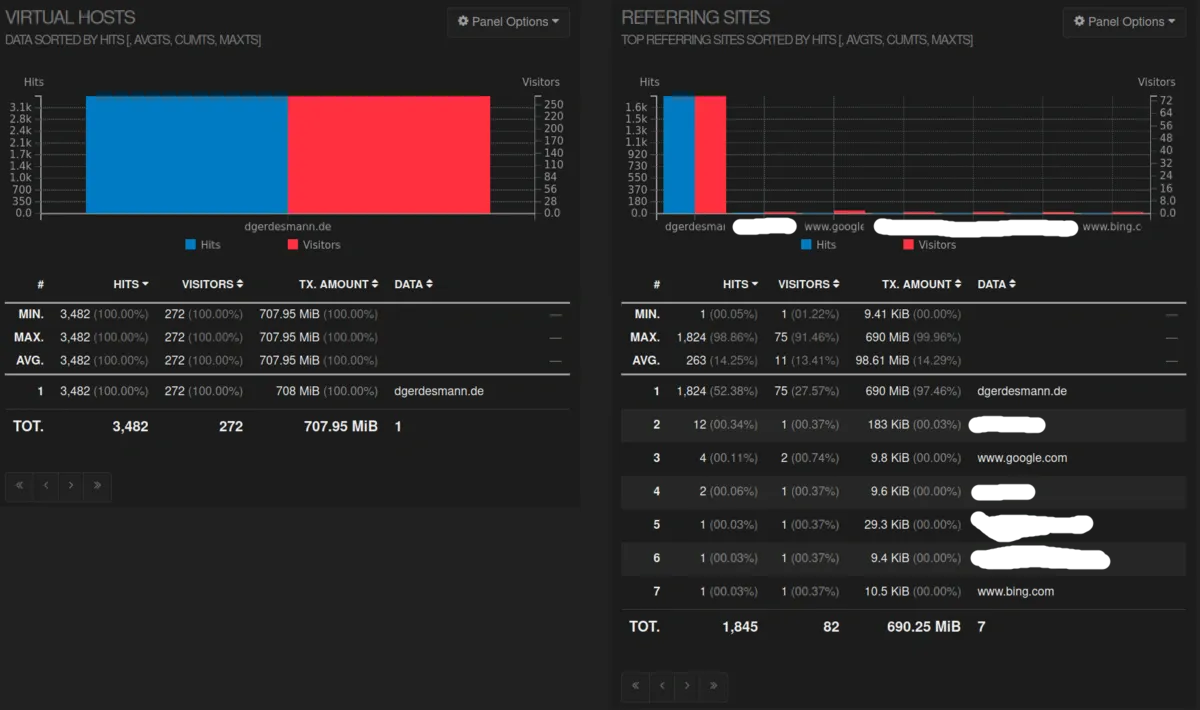
Virtual hosts (not very useful here as there’s only one) and referring sites:
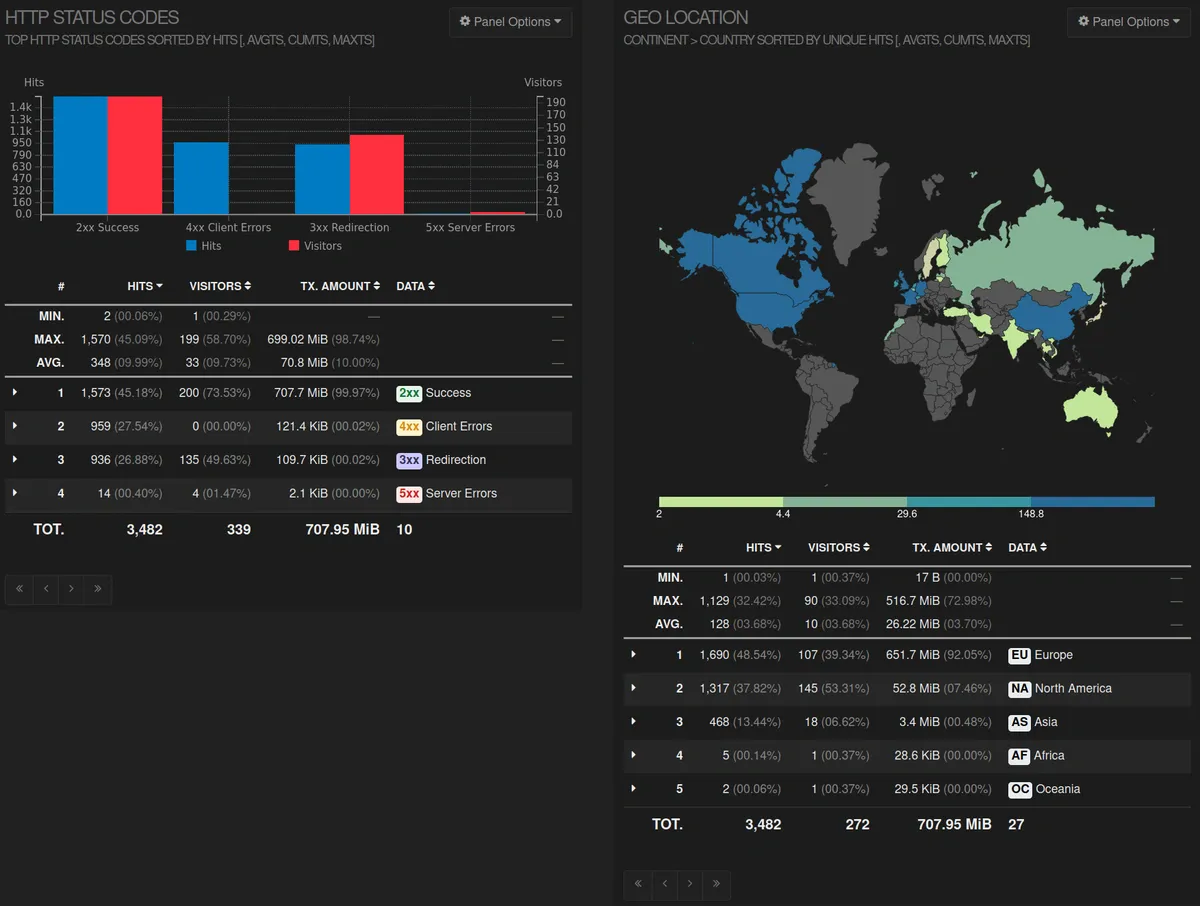
HTTP status code and geolocation:
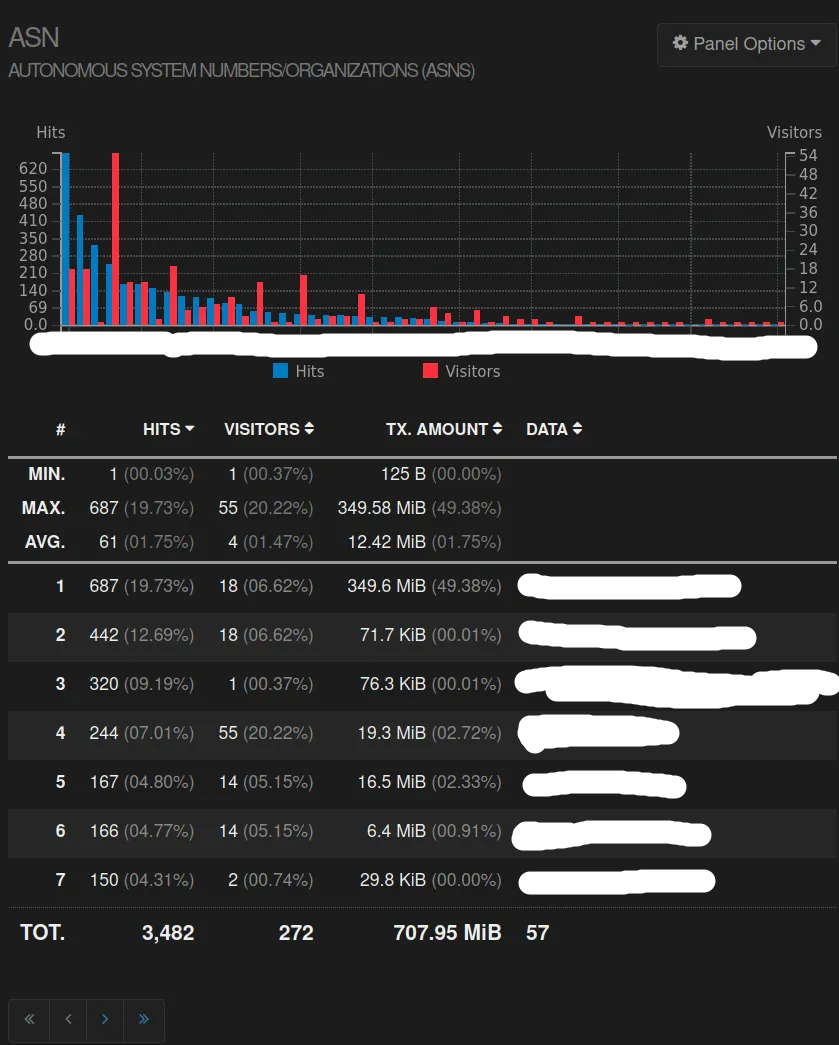
Finally, some information about Autonomous System Numbers, mostly Internet Service Providers from users. I have redacted the ASN information.
In summary, GoAccess visualizations show how much traffic there is, where users are coming from, what sites are referring them, when and what is being accessed the most, and provide error-related information useful for identifying potential problems. For personal sites, this is usually sufficient. However, if you need to track specific user behavior such as time spent on a resource, clicks and interactions, then you would need to use Matomo or other tools that do not rely solely on server logs. A common use case would be an educational resource site that you want to improve by understanding user behavior in detail.
That’s it, thank you for following along!
Giving Back
Ah, these great open source combos, what’s not to like? The GoAccess contributors around Gerardo O. develop a great tool, and the goaccess-for-nginxproximanager contributors around Xavier Hernandez provide a way for us to use it easily and securely. To show your appreciation and motivate them to work on the projects, you can visit their linked GitHub pages. Sponsor them, give their projects a star, or participate in discussions and fixes to give back.